
Forest income and value
Compare returns from forest management.
Compare the financial case for inventory-led decisions, forest-health management and wind-damage recovery.
Wind damage and timber income
Find the damage. Work out what you can recover.
Start with the wind-damage map. Match the affected ground to the timber inventory, then compare salvage proceeds and costs.

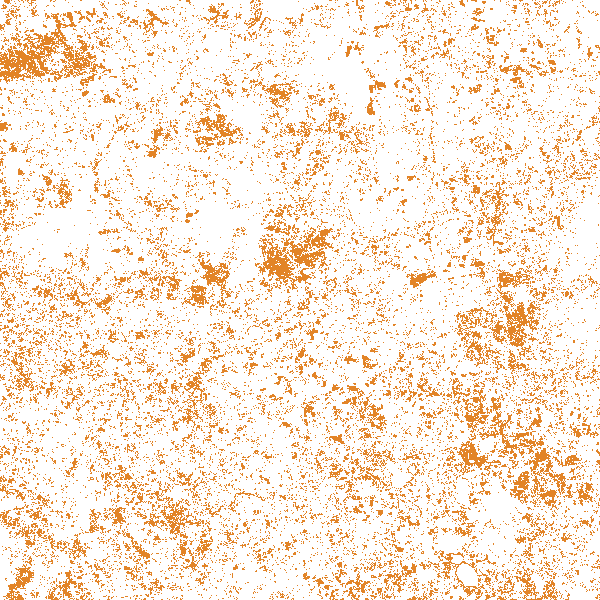
Orange: damage detections · Green: inventory
- Mapped wind-damage footprint
- 29,022 acres
- Inventory within that footprint
- 2,749,088 US short tons
All mapped damage pixels in this delivery overlap the inventory. These are landscape totals, separate from the parcel tour. Inventory weight is not a count of fallen or salvageable trees.
Published-benchmark scenario: if the softwood inventory inside this mapped footprint requires salvage. Florida pine prices are applied to the softwood classes; hardwood is excluded from dollars. The map does not measure the fraction of trees requiring salvage.
UF/IFAS describes salvage receipts of 10–15% of normal stand value. This combines recovery and price effects, not the percentage of trees damaged.
MSU Extension reports typical fees of 10–15% of sale receipts, with some sales reaching 25%. Scope and local quotes vary.
Optional. Add owner-paid road repairs, cleanup, replanting and other costs. Exclude buyer-paid logging costs already reflected in a stumpage offer. Unentered costs remain unknown.
Salvage cash after consultant fee
$3,647,895
Conditional scenario for the full mapped softwood inventory. Before other owner-paid costs and tax. This is not total forest investment profit.
- Pine-price reference value
- $42,916,407
- Gross salvage receipts
- $4,291,641
- Consultant fee
- $643,746
- Other owner-paid costs
- Not entered
- Reference value not recovered
- $38,624,766
The remaining cost allowance is $125.70 per mapped acre before this salvage scenario turns cash-negative. The value not recovered is a scenario comparison, not measured damage loss.
Assess damage on your holdings ↗After wind damage, timber condition affects the sale.
UF/IFAS explains how broken stems, decay and insects can reduce usable timber and its price. Use the damage map to locate affected areas, then check tree condition and access. A forest-stress signal does not establish the cause or the dollar loss. A separate health-loss total needs matched damage and inventory data, with overlapping wind damage counted once.
Published inputs and research
- UF/IFAS · Salvage-value benchmark ↗
Prepare Your Forest Property for Hurricane Season gives a 10–15% normal-value recovery benchmark for storm-damaged stands. It is extension guidance, not a measured outcome for this delivery.
- UF/IFAS / TimberMart-South · Q1 2026 prices ↗
Florida averages: pine sawtimber $29/ton and pine pulpwood $9/ton. Used here as a price scenario for mapped softwood inventory, not a local salvage bid or an appraisal. No hardwood price is substituted.
- Mississippi State · Consulting fees ↗
Choosing a Consulting Forester, April 2026, gives typical percentage fees and notes that some sales cost more. The calculator starts at the upper end of its typical range.
- UF/IFAS · Assessing hurricane-damaged timber ↗
Explains how damage type, product quality, access and deterioration affect salvage decisions. Supports field checks and separate treatment of healthy, damaged and destroyed trees.
- Lamica, Parajuli & Brandeis · 2025 study ↗
Forest Policy and Economics, 178, 103590. Hurricane Michael affected stumpage prices differently across products and locations. Its price effects are not used as a damage percentage or multiplied into the salvage benchmark.
- Mississippi State · Timber weight units ↗
US timber transactions use a 2,000-pound ton. The source inventory uses 1,000 kg tonnes, verified against its volume and density fields in three delivery tiles. The calculator converts units before applying prices.
How the map and calculation connect
Mapped area = the count of valid wind-damage pixels × 100 square metres, converted to acres. Inventory = green metric tonnes per acre × intersecting damage-pixel area within each 20 m inventory cell. Detection scores are not multiplied into area or value. Source mass is converted from metric tonnes to US short tons by multiplying by 1,000 / 907.18474. Pine-price reference = converted softwood sawtimber × $29 + converted softwood pulpwood × $9. Salvage receipts = reference × selected value recovery. Cash after fee = receipts × (1 − fee share). Entered extra costs = mapped acres × cost per acre. No annual storm probability is used.
Wind delivery version 2026-09-04. Inventory version 2026-03-31. These are delivery versions, not confirmed storm or observation dates. The source does not supply those dates.
Damage scores identify detections, not severity or a future risk forecast. Transparent pixels do not prove absence of damage or complete observation coverage. Inventory density is treated as uniform within each 20 m cell. The financial example assumes the matched softwood inventory is subject to salvage; the actual share, species, access, buyer acceptance and current bid must be verified for a sale. The source inventory predates the damage delivery, but its timing relative to the storm is unconfirmed. No insurance payout, tax credit or Linda-attributable profit uplift is included.
Runs in your browser. No login, tracking or contact details required.
These are separate comparisons with different time horizons. Do not add them into a total ROI or count the same trees twice.